

SQL Server slow? We find the cause.
Performance problems in SQL Server applications are our daily business, whether acute, targeted or ongoing. We examine application, queries, plans and platform in context and back every finding with evidence.
Sound familiar?
Slow since the update
After a release, a version change or a configuration change, things run noticeably differently.
Sporadic hangs
Sometimes the system stalls, most of the time it does not. By the time someone looks, the trail is gone.
High load for no clear reason
CPU or I/O maxed out, without user numbers or data volume explaining it.
Blocking & deadlocks
Sessions wait on each other, transactions abort, users report errors.
Nightly jobs take too long
Maintenance, imports or reports no longer fit into their time window.
More hardware did not help
More cores, more RAM, faster storage, and the problem is still there.
Acute, targeted or ongoing.
When something is on fire, a reliable trail is what counts.
We support you at short notice, often already via a Teams or Zoom session with a shared screen. Stabilize first, then prove the cause so that the problem does not come back.
- Assess the situation
What is affected, since when, what changed most recently? - Narrow it down
Look at wait times, blocking, plans and resources in the running system. - Immediate measures
Agreed with you and with a clear way back. - Prove the cause
Secure evidence so that the actual cause can be fixed. - Finding
Briefly documented: what was going on, what was done, what is still open.
Investigate in a structured way, recommend in order of priority.
Do you want the whole system checked, not just the performance? Then the SQL Server Health Check is the right path. The performance audit is one of its variants.
- 01
Case history
Understand the application, its usage, anomalies and the measures taken so far.
- 02
Configuration
Check instance, databases, storage and maintenance for plausibility.
- 03
Metrics
Read wait times, resources and trends in context.
- 04
Workload & plans
Examine the most expensive and most conspicuous queries and their execution plans.
- 05
Recommendations
Prioritized, justified and with a way to verify the effect.
case history   Response times at month-end close much worse than during the rest of the month.
configuration  Parallelism and memory plausible, statistics maintenance irregular.
metrics        Wait times mostly from reading large amounts of data.
workload       A few reporting queries cause most of the load.
plans          Missing filtering before a large join, unfavorable estimate.
recommendation Test an index and a query change, compare the effect at the next close.
Continuous performance engineering.
For applications where performance is business-critical. We observe, investigate, improve and verify the effect, month after month and within the agreed scope.
As MX-Care for ongoing support, as MX-Intensive for phases with particular needs. With MX AIOps, our collection and analysis software, which runs in your environment and does not sync any data to a public cloud.
- Analysis & goal setting
Define together what “good” means for your application. - Data collection
Continuous and local, with MX AIOps. - Optimization & reporting
Prioritized measures and their measured effect. - Knowledge transfer
So that your team understands the connections.
Evidence instead of gut feeling.
For more than ten years we have been developing our own tools and continuously revising them to deliver even better insights.
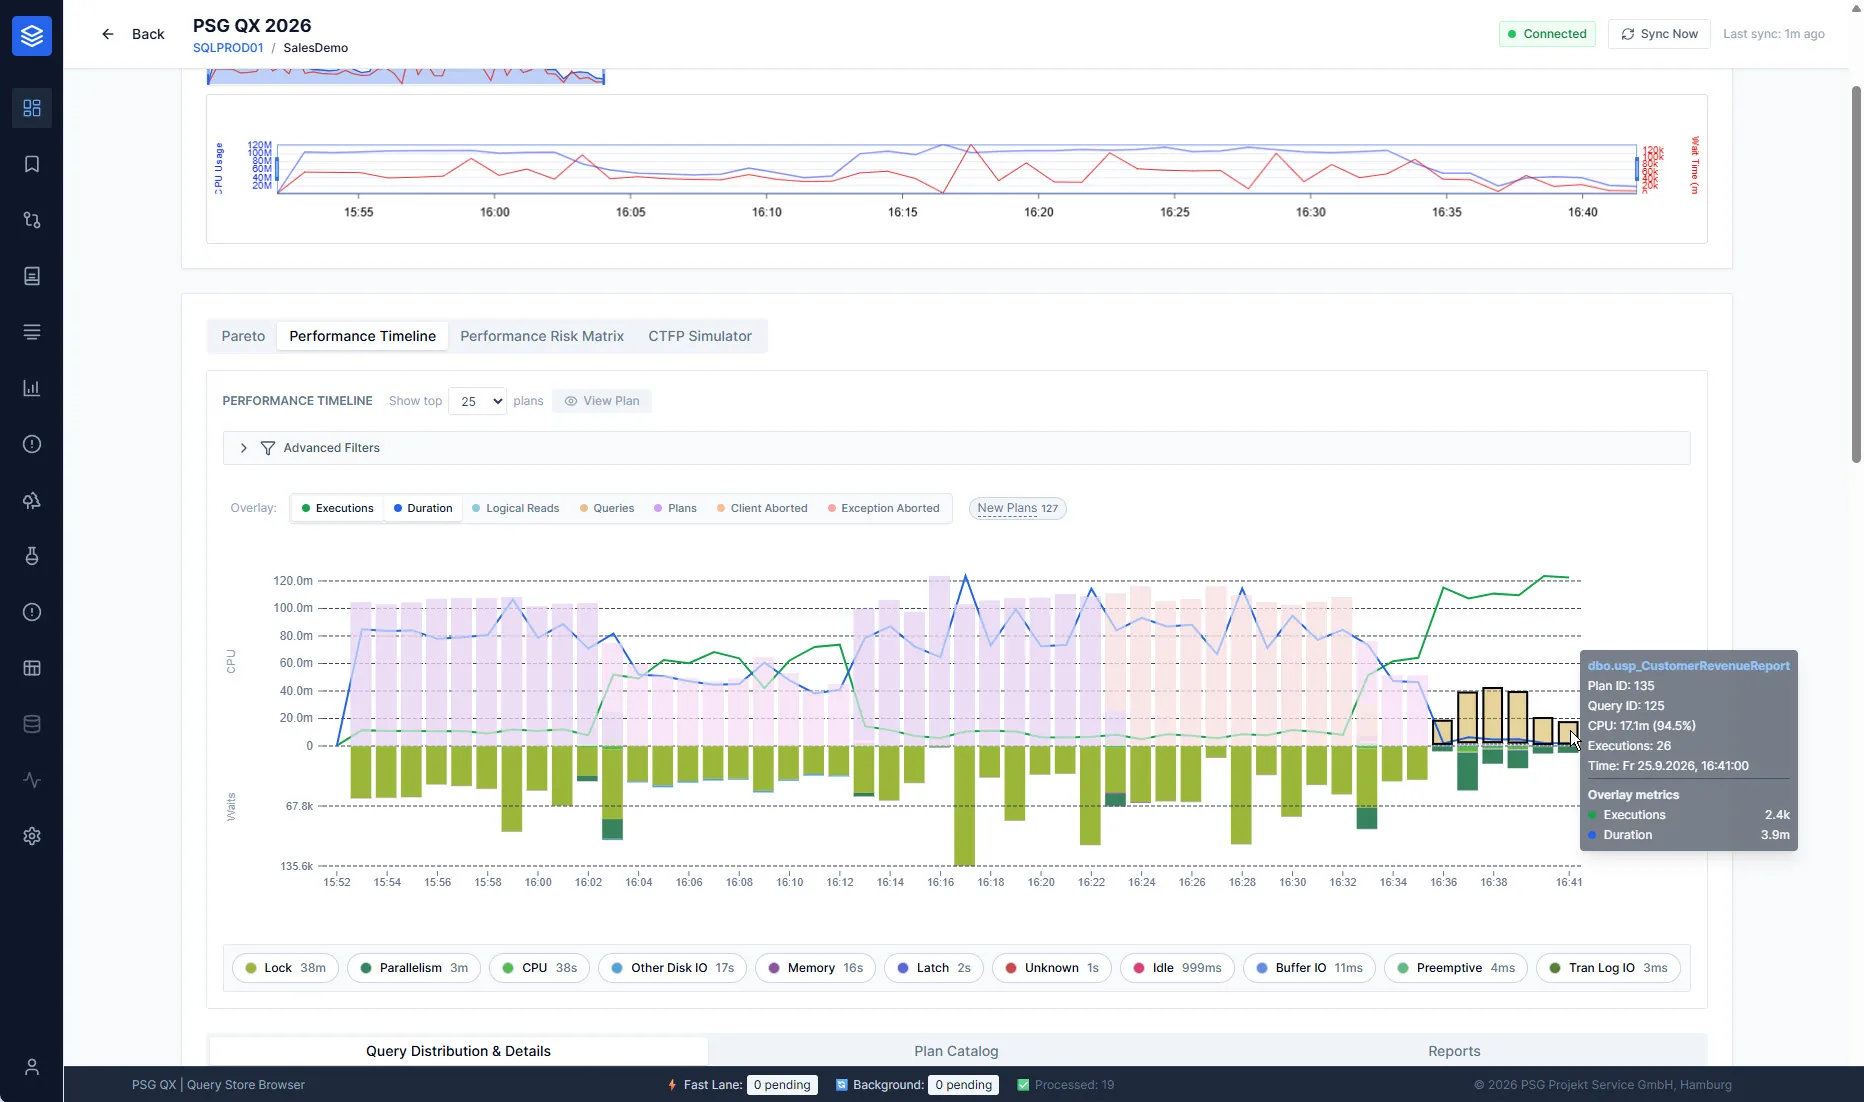
PSG QX
Analyzes the execution history: which query, which plan, since when, and what a change actually achieved.
QX Recorder
Captures the evidence of sporadic problems. If the problem occurs at night, the data is there in the morning.
MX AIOps
Collection and evaluation for continuously supported environments, with traceable rules and statistical methods.
Answered briefly.
Doesn't more hardware simply help?
Sometimes. Often, though, additional hardware only postpones the problem or makes it more expensive. If the cause lies in queries, plans, indexes or data access, a targeted change usually helps more sustainably.
Do you need access to our systems?
Not necessarily. For quick help, a Teams or Zoom session is often enough: you share your screen, we look together and give you the decisive nudge in the right direction. Our analysis tools run locally in your environment.
We already have monitoring. Why PSG, then?
Monitoring shows that something is conspicuous. We clarify why, and what the most effective change is. We are glad to use existing data from your monitoring as a starting point.
Do you work together with the software vendor?
Yes. If the cause lies in the application, we coordinate findings and measures with you and the vendor.
How is billing handled?
Depending on the arrangement, as a project, through a block of consulting hours or as an ongoing agreement with PSG MX. In the first conversation we clarify what fits your situation.
Describe your problem to us.
For acute problems, a phone call is best. In the first conversation we assess the situation and propose the next step.