

Microsoft SQL Server · Health check & audit

SQL Server Health Check,
tailored to your question.

Health check, performance audit, review or assessment: everyone calls it something different. With us, the same process is behind all of them, with fixed steps, a fixed assessment framework and a report that backs every finding with evidence.

report · page 1 · summaryillustrative example
  • Configuration & instance2 notes
  • Version & patch levelCU outdated
  • Security & permissionsno findings
  • Backup, restore & recoveryrestore never tested
  • Maintenancestatistics irregular
  • Workload & queries3 queries, 60% of CPU
The three most important measures
  1. Test a restore of the main database and measure the time
  2. Adjust statistics maintenance to the load times
  3. Investigate the three most expensive queries in detail
One process, many variants

What always stays the same, and what we tailor.

No two health checks are alike, and yet we don't reinvent them each time. The sequence, the assessment framework and the report are fixed. What we look at, and how deeply, we define with you at the kick-off.

Always the same
  • Fixed sequence of stepsFrom the kick-off to the results review.
  • Assessment framework with fixed areasFrom configuration down to the individual query.
  • Finding formatEvery finding with observation, evidence, risk, recommendation and effort.
  • Report and review meetingThe same structure, so you can compare reports over the years.
Tailored
  • FocusOperations, performance, availability, migration, upgrade or data warehouse.
  • Depth per areaIn depth, at overview level or deliberately left out.
  • ScopeOne instance, one application or an entire environment.
  • Data collection periodA snapshot, or a period that includes your typical load peaks.

The kick-off ends with a written assessment brief: goal, variant, scope, data collection, dates and effort. That way both sides know in advance what will be on the table at the end.

Process

Six steps, every time.

  1. 01

    Kick-off

    About one hour: clarify the trigger, goals and variant, and name contacts. The outcome is the assessment brief.

  2. 02

    Data collection

    Capture configuration and metrics. For performance questions, over a period that includes your typical load peaks.

  3. 03

    Analysis

    Work through each area of the assessment framework, back findings with evidence and put them in context.

  4. 04

    Report

    Fixed structure: summary, list of findings, action plan, appendix with measurement data.

  5. 05

    Results review

    With your technical team and, on request, with the stakeholders, each in terms that suit them.

  6. 06

    Follow-up measurement optional

    After measures have been implemented, we measure again. The report serves as the baseline.

assessment-brief.txtillustrative example
goal        Clarify whether the environment runs as planned after the hardware replacement.
variant     After migration / hardware replacement, focus on workload and maintenance.
scope       2 instances, 14 databases, one core application.
collection  Your team runs the scripts; 10 business days incl. month-end close.
dates       Report and review meeting in week 44.
effort      Agreed in writing before data collection begins.
What we look at

Nine areas, from the foundation to the query.

The assessment framework is the same in every health check. Depending on the variant, we either investigate an area in depth or get an overview.

01

Configuration & instance

  • Do memory, parallelism and tempdb fit the load?
  • Which settings deviate from the default for no reason?
02

Version, patch level & end of support

  • Which updates are missing, and which are known to be problematic?
  • When does support for your version end?
Check your build yourself in advance →
03

Security & permissions

  • Who has more rights than they need?
  • How are logins, encryption and auditing handled?
04

Backup, restore & recovery

  • Can you actually restore from the backups?
  • How long does it take, and how much data is missing afterward?
05

High availability & DR

  • Does failover work the way it is documented?
  • Do RPO and RTO match your objectives?
06

Maintenance

  • Do index, statistics and integrity checks run, and at the right time?
  • Do the jobs still fit their time window?
07

Resources & capacity

  • Where is the bottleneck: CPU, memory, I/O or network?
  • How long will the platform last at today's growth rate?
08

Workload & queries

  • Which queries cause the most load?
  • Where do plans, waits and blocking lose time?
09

Edition & cores

  • Do you use what you pay for?
  • Which edition and core count does the load really need?
Your focus

Six variants, one framework.

The most common triggers each have a name with us. Every variant uses the same assessment framework but sets different priorities. Select a variant to see what it concentrates on.

Where you stand

Basic health check

“Is our SQL Server on a solid footing, and where are the biggest risks?”

Typical trigger
A system has been taken over, has not been reviewed for a long time, or responsibility is changing. Often also before an operations contract or an audit.
Data collection
A snapshot of configuration, backup, maintenance and permissions, supplemented by the metrics since the last restart.
First in the report
What can cost you data or availability, followed by everything that makes operations needlessly difficult.
When it is slow

Performance audit

“Where does our application lose time, and which change helps the most?”

Typical trigger
Response times fluctuate, load rises for no clear reason, nightly jobs no longer fit their time window.
Data collection
The execution history in the Query Store of your databases, analyzed with PSG QX. It should include your typical load peaks, such as a month-end close.
First in the report
The most expensive queries and their plans, waits and bottlenecks. Measures sorted by expected impact.
More on performance analysis →
When downtime is acceptable, but not for long

Availability review

“Does our recovery live up to what we promise?”

Typical trigger
New requirements for data loss and downtime, an audit, or an outage that ended well only by a narrow margin.
Data collection
Availability groups or clusters, backup chains and restore times. On request, we accompany a restore or failover test.
First in the report
Your RPO and RTO objectives next to the values that are actually achievable today.
More on high availability →
After the move

After migration or hardware replacement

“Is the new environment running the way it was planned?”

Typical trigger
New SQL Server version, new hardware, a move to virtual machines or to a different data center.
Data collection
Configuration and metrics of the new environment, compared with measurements from the old one where available. Compatibility level and plan changes get particular attention.
First in the report
Settings that were left behind during the move, and queries that have run worse since.
Before the next version

Upgrade & license check

“Which version, edition and core configuration do we really need?”

Typical trigger
A version is running out of support, an upgrade or consolidation is coming up, or the license costs are to be reviewed.
Data collection
Versions, editions and features in use, core count and actual utilization over a representative period.
First in the report
An upgrade path with its risks, plus edition and cores from your point of view. We don't resell licenses.
Our position on edition & cores →
For data warehouses

Data warehouse audit

“Will our data warehouse carry us through the next few years?”

Typical trigger
Load processes are getting longer, reports slower, and the data warehouse has grown over the years.
Data collection
Load processes, data model, partitioning, columnstore indexes and reporting queries over at least one full load cycle.
First in the report
Load window, storage requirements and query paths, and where columnstore, partitioning or a different loading approach helps.
Which variant looks at which assessment area, and how deeply (illustrative)
Assessment area
Configuration & instance
Version & patch level
Security & permissions
Backup & recovery
High availability & DR
Maintenance
Resources & capacity
Workload & queries
Edition & cores

in depthoverviewnot included

Your trigger isn't listed? Then we tailor the health check to fit at the kick-off. The framework stays the same.

For software vendors: the Product Performance Review →
What you get

A report you can verify.

Every finding stands on its own: what we observed, how it shows, what it puts at risk and what we recommend. That way every recommendation can be checked, prioritized and implemented individually.

  • One-page summary
    A traffic-light rating per assessment area and the three most important measures, readable for management as well.
  • List of findings
    Area, observation, evidence, risk, recommendation, effort and priority.
  • Action plan
    Immediate, in the coming weeks, strategic.
  • Appendix
    Measurement data and method, so the result remains traceable.
finding-07.txtillustrative example
area            Backup, restore & recovery
observation     Full backup daily, log backup hourly. A restore has never been tested.
evidence        Backup history of the last 90 days; no restore entries.
risk            Up to 60 minutes of data loss; duration of recovery unknown.
recommendation  Log backup every 15 minutes; restore test with timing, then quarterly.
effort          low
priority        immediate
Why not just use a check script?

The list is free. The interpretation isn't.

Good check scripts have been available for free for years.

What a list can't do: decide which of forty warnings actually matters in your environment.

  • Interpretation
    What is a risk for your application and your operations, and what is merely a deviation from the textbook?
  • Prioritization
    Which three measures bring the most, and in what order?
  • Evidence over time
    A script sees one moment. We measure across your load peaks.
  • Verifying the effect
    After implementation, we measure again to see whether the measure worked.
Afterward

The report is a beginning, not an end.

Your own team implements many of the measures. We write the report so that this works. Where you would like support, there are three ways, and for intensive health checks our analysis tool.

After implementation

Follow-up measurement

We measure again and compare with the report. That shows you what the measures have actually achieved.

On a cycle

Repetition

Annually or after major changes, with the same framework. That makes the reports comparable over the years.

Ongoing

DBA Pool & PSG MX

Operations together with your team, or continuous performance engineering for critical applications.

Ongoing support →
Optional · for intensive health checks

Look deeper and longer with PSG QX.

In an intensive health check, we can, on request, use PSG QX to analyze the Query Store of your databases. It contains the execution history of the past weeks: which query, which plan, since when and with which waits. If the Query Store is not yet enabled, we turn it on at the start and let it fill up. QX does not need to run continuously for this.

  • A look back instead of a snapshot
    The history also shows load peaks and problems that are not occurring right now.
  • Down to the line of code
    Findings point to the query and the spot that causes the load.
  • Follow-up measurement with the same view
    After measures are implemented, the same analysis shows before and after.
More on PSG QX →
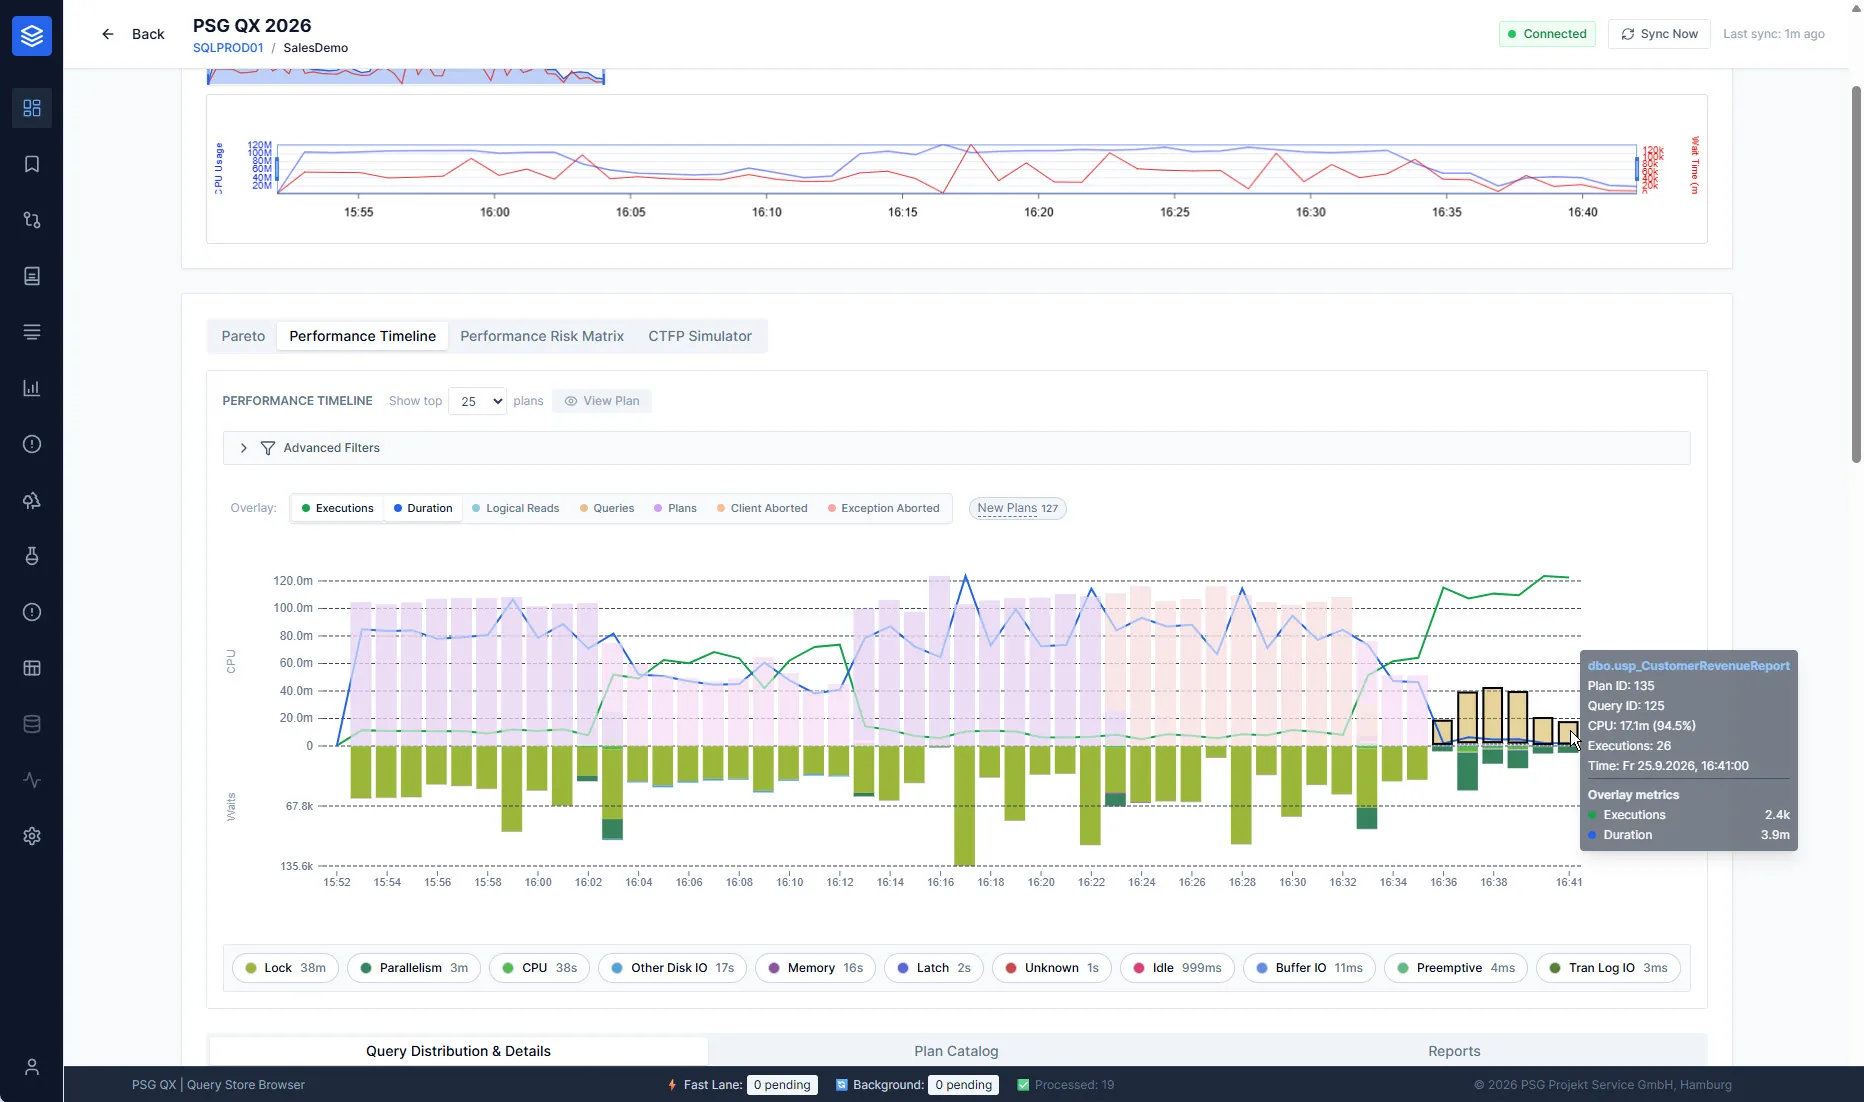
PSG QX · Performance timeline
PSG QX: performance timeline with CPU, waits and plans
Frequently asked questions

Short answers.

How long does a SQL Server Health Check take?

That depends on the variant. The kick-off takes about an hour. A snapshot is quickly collected; for performance questions we measure over a period that includes your typical load peaks, often one to two weeks. We record the schedule in the assessment brief.

Do you need access to our servers?

Not necessarily. Data collection can run through scripts that your team executes, or jointly in a Teams or Zoom session with a shared screen. Whether and how we access systems directly is defined in the assessment brief.

Which data leaves our environment?

We collect configuration, metrics and query statistics, not the contents of your tables. You see beforehand exactly which data is handed over, and we define it in the assessment brief.

What do we need to prepare?

A contact from operations or development, the answers from the kick-off and, if available, known issues and earlier reports. We bring the rest.

What does a health check cost?

The effort depends on the variant and scope. We agree it in writing after the kick-off, before data collection begins.

Is a health check the same as a performance analysis?

The performance audit is one of the variants. A basic health check looks more broadly, including backup, security and maintenance. If something is on fire right now, a health check is the wrong path: our Performance Troubleshooting helps then.

Can we implement the report ourselves?

Yes. Every recommendation is substantiated and comes with effort and priority, so that your team can implement it. On request, we support individual measures or measure again afterward.

Contact

Which question should your health check answer?

In the first conversation we clarify the trigger and goal and propose a suitable variant.

Phone+49 40 39 88 28 75Emailinfo@psg.deAddressPSG Projekt Service GmbH
Neuer Wall 80, 20354 Hamburg